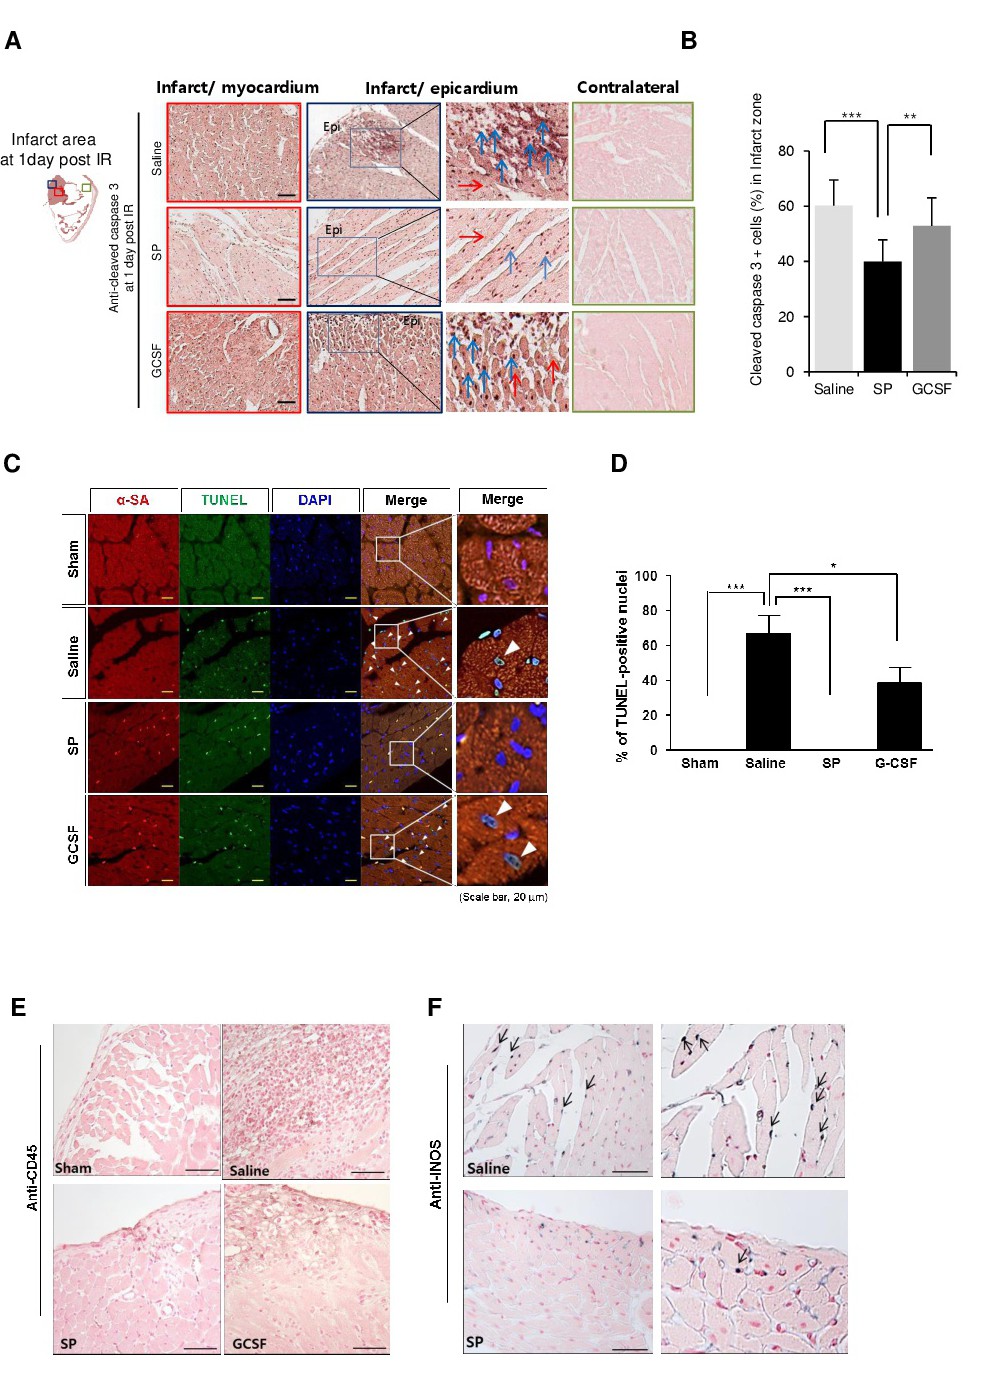
Fig. 4. Regulation of ischemia reperfusion injury (IRI)-induced myocardial apoptosis by substance P (SP) injection. Comparison of apoptosis within the infarct zone 1day post-IRI with SP injection versus GCSF injection by immunohistochemical staining. (A, B) The blue arrow indicates cleaved caspase 3 (+) apoptotic cells and the red arrow indicates normal cells. Sham-operated (n = 4), IRI + saline (n = 6), IRI + SP (n = 6), IRI + GCSF (n = 6). Scale bar: 100 µm. (C, D) SP was intravenously injected to rats 1day post IR and apoptotic cardiac myocytes were determined with TUNEL (FITC), sarcomeric α-actinin (TRITC) and DAPI staining. TUNEL-positive myocyte nuclei were observed by confocal microscopy LSM700 (Carl Zeiss, Germany) and analyzed from five different high-power fields (X 400). White arrows indicate TUNEL- and sarcomeric α-actinin-positive nuclei. (E, F) Immunohistochemical staining for CD45 and iNOS in cardiac tissue post IR. SP was intravenously injected into rats post IR and inflammatory cells in cardiac tissue was determined by staining for CD45 (leukocyte) and iNOS (activated macrophage). Scale bar: 50µm. Black arrow: iNOS+ cell The data are shown as the mean ± SD. *p<0.05, **p<0.01, ***p<0.001.